
Metrics
Host, container, service, database and custom metrics, aligned in time.
Metrics, logs, traces, profiles, replay and database statements are captured once by the agent, time-aligned and linked.
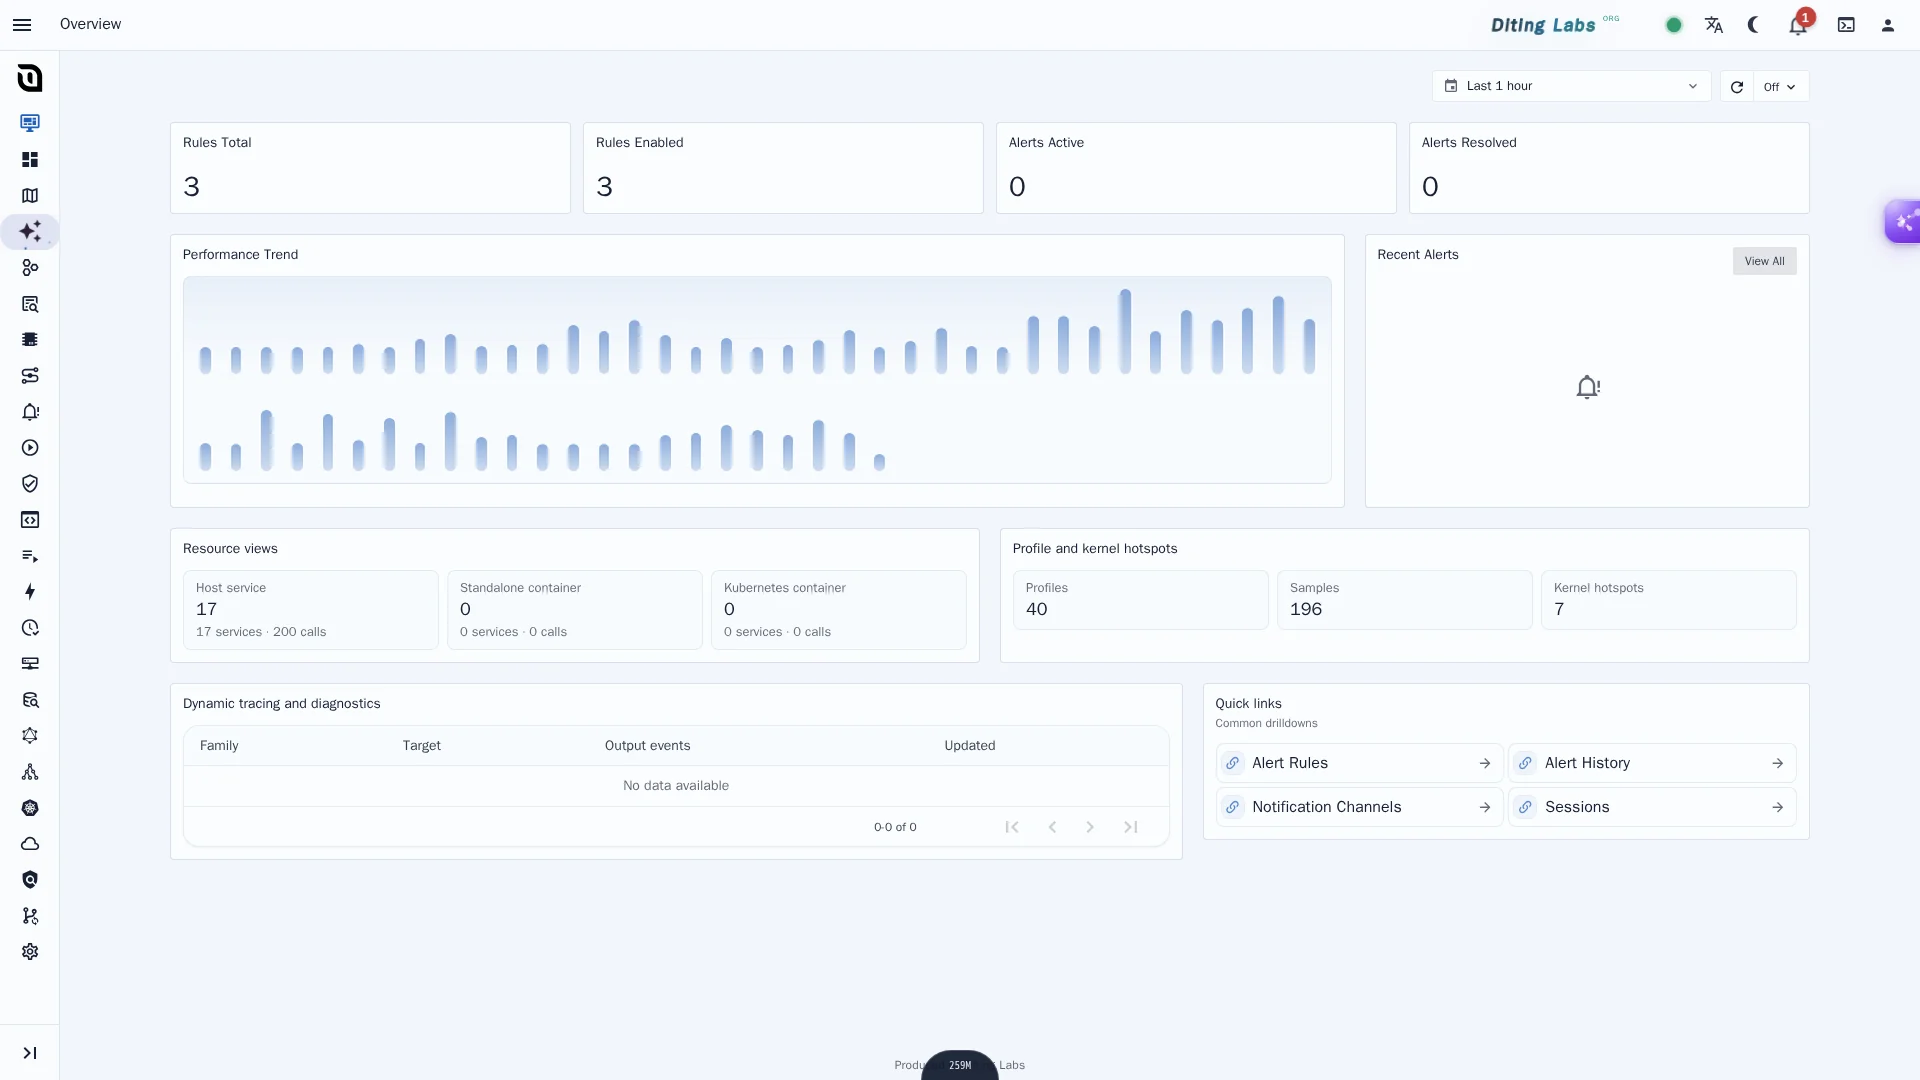
Click a spike and land on the trace. Jump from a trace to its logs. From a log to the session. Context survives every hop.
Host, container, service, database and custom metrics, aligned in time.
Collect, search, add context and alert without changing log formats.
Distributed traces, waterfalls and error attribution, with SQL inside spans.
Browser replay, linked both ways with traces and logs.
CPU and memory hotspots attributed to functions and kernel stacks.
Statements and plans parsed on the wire, no driver.
| Time | Unified timestamps and clock correction across hosts |
|---|---|
| Keys | trace_id, session_id, host_id, service, pod |
| Retention | Configured per signal, hot and warm tiers |
| Ingest | Agent capture, plus OTLP |
Tell us what you run: OS, kernel, public network or not, virtual machines or clusters. We will map the path in.